
Policy brief

Tunisia's Date Exports: One Dollar of Water in Every Two

The fossil water behind Tunisia's exported dates is worth about half the revenue those exports earn — and falling water-per-tonne is hiding rising extraction.

  • agriculture
  • water
  • economics
  • sustainability
  • governance
  • policymakers
  • researchers
  • tunisia
  • north-africa
  • global-south

Summary

A tanitdata policy brief on the fossil-water debt embedded in Tunisian date exports. On the most conservative basis, the replacement-cost value of the non-renewable groundwater consumed to grow exported dates is about 53% of export revenue — roughly $161M against $305M in 2024, or $1.05 of unpriced depletion in every kilogram sold for about $2.00. Water use per tonne fell over the period while total extraction more than doubled.

Finding

Every kilogram of Tunisian dates exported for about two dollars carries roughly one dollar of unpriced fossil-water depletion — $161M against $305M of export revenue in 2024, on the most conservative water basis.

Recommendation

Trade accounts record this depletion at zero. Report embedded fossil-water debt alongside export earnings — and never water-per-tonne alone, which halved while total extraction rose, making relative decoupling look like progress.

Key findings

  • On the conservative consumptive basis, the replacement-cost value of the fossil water embedded in exported Tunisian dates is about 53% of export revenue — $161M against $305M in 2024, or roughly $1.05 in every kilogram sold for about $2.00.
  • The range is the result, not the point estimate: ~17% under every adverse assumption stacked together, ~53% central, ~83% at the high replacement price, and ~106% once irrigation losses are counted as permanent.
  • The books already declare mining. Kébili's recorded deep-aquifer exploitation rate is 228–230% of renewable resources, and modelled extraction for dates alone (1,082–1,900 Mm³/yr) exceeds total recorded extraction across all uses (967 Mm³/yr).
  • Water per tonne fell 39% between 2002 and 2024 while total fossil water mined more than doubled (103 → 230 Mm³/yr) and exported tonnage roughly tripled: relative decoupling, not absolute.
  • Export earnings per unit of mined water stayed near 2 across the whole record and never fell below 1 on the consumptive basis — revenue nearly tripled, but the water extracted to produce it grew almost as fast.
  • In 2017 the EU bloc took ~44% of export value and Morocco ~26% as the single largest destination, so EU supply-chain due-diligence regimes would cover under half this trade and miss the largest buyer entirely.

Recommendations

For policymakers

Report embedded fossil-water depletion alongside export earnings in agricultural trade statistics. The inputs are already public: satellite-derived area, published crop-water requirements, and the regional extraction records.

Never publish water-per-tonne as a standalone indicator. It fell by more than a third while absolute extraction more than doubled, and reporting it alone turns a worsening balance into an apparent efficiency gain.

For researchers

The framework is transferable to fossil-aquifer export systems meeting five stated conditions — a dominant water-consuming crop, published crop-water requirements, a sub-national yield record, an identifiable replacement-cost backstop, and basin-scale depletion evidence. The Ogallala has the strongest yield record and is the obvious next case.

For international development actors

Commodity-level water-depletion metrics are computable today from public data, which makes them legible to supply-chain due-diligence regimes such as the EU CSDDD. Two limits are structural: the regime is still being built, and it reaches only the ~44% EU share of this trade.

Methodology

Bottom-up accounting for Tunisia's four date-producing governorates (Tozeur, Kébili, Gafsa, Gabès), 2002–2024. Fossil extraction is bounded between a consumptive floor (satellite-derived palm area × published net crop-water requirements) and a gross-extraction ceiling (the floor divided by irrigation efficiency, β = 0.37–0.65). GRACE/GRACE-FO gravimetry is used only to confirm basin-scale depletion independently, never to attribute a crop-specific footprint. The consumptive quantity is valued at desalination replacement cost across a $0.24–$1.10 per m³ band. Export value and volume are from the INS DataStore (2018 onward) and UN Comtrade (2002–2017).

Questions this brief answers

  • How much non-renewable water is embedded in Tunisia's date exports, and what is it worth?
  • Why is falling water use per tonne not evidence of progress?
  • How do we know the official extraction records undercount?
  • Where would a commodity-level water-depletion measure actually be used?

Download PDF →

Tunisia is among the world’s leading date exporters by value. The oases that produce those dates sit on confined aquifers that recharge over millennia, if at all. When the crop is exported, the water is not: the commodity and its revenue leave, and the permanent depletion stays behind — priced nowhere on the invoice.

A new preprint from the studio puts a number on that gap. On the most conservative defensible basis, the fossil water consumed to grow Tunisia’s exported dates is worth about half the revenue those exports earn.
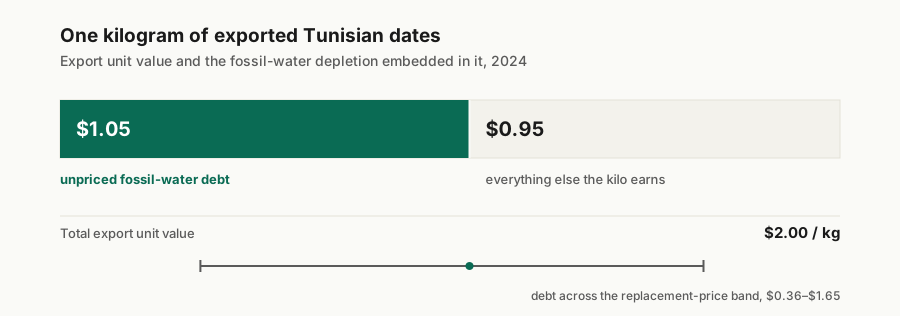
A bar representing the $2.00 export value of one kilogram of Tunisian dates, with $1.05 of it shaded as embedded fossil-water debt and the remaining $0.95 unshaded. A range marker below shows the debt spanning $0.36 to $1.65 across the replacement-price band.
Central case, 2024: $1.05 per kilogram of unpriced fossil-water depletion against a $2.00 export unit value.

1. One dollar of water in every two dollars of dates

Valuing the permanently lost water at what it would cost to replace it — the desalination backstop, the only substitute for the municipal supply the same aquifer ultimately feeds — gives a 2024 debt of $161 million against $305 million of export revenue: 53%.

That number only means something with its range attached. Stack every adverse assumption together and it falls to ~17%. Take the high end of the replacement price and it reaches ~83%. Count irrigation conveyance and percolation losses as permanently gone — which, for a confined fossil reserve, they are — and it passes parity at ~106%.
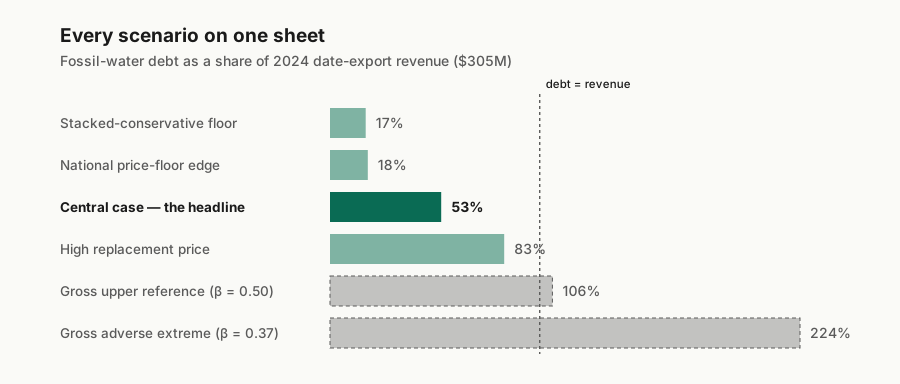
Horizontal bars showing fossil-water debt as a share of 2024 export revenue under six scenarios: 17 percent, 18 percent, 53 percent for the emphasised central case, 83 percent, and two hatched bars at 106 and 224 percent marked as a conditional upper reference. A dashed line marks the 100 percent point where debt equals revenue.
The range is the result. Solid bars price the consumptive floor; hatched bars are a labelled upper reference, never the headline.

The headline prices the consumptive quantity — the water biologically and permanently evaporated — not gross extraction. That is the conservative choice, and it understates what the fossil stock actually loses.

2. Why this is not a water footprint

Virtual-water accounting made water in trade visible, but it treats a cubic metre of fast-recharging river water as equivalent to a cubic metre of Pleistocene-age confined groundwater, and it stops at volume.

Three things are different here. The measure isolates the non-renewable fraction. It prices that fraction rather than counting it. And it carries the resulting debt on the traded product, at the commodity level — which is the unit at which trade rules and supply-chain obligations actually operate.

3. What the records already admit

The strongest evidence that extraction is undercounted comes from the administration’s own books, before any modelling enters.

Satellite gravimetry does one job in this argument and no more: GRACE and GRACE-FO confirm, independently of any administrative record, that the basin is losing storage. They are far too coarse to attribute that loss to dates, and the study does not use them for that.

4. The trap: efficiency that isn’t

Reporting the debt per tonne alone would invert the finding. Water per tonne fell over the study period, because yields rose and divided a roughly fixed per-hectare requirement across more output. Read naively, that looks like progress.
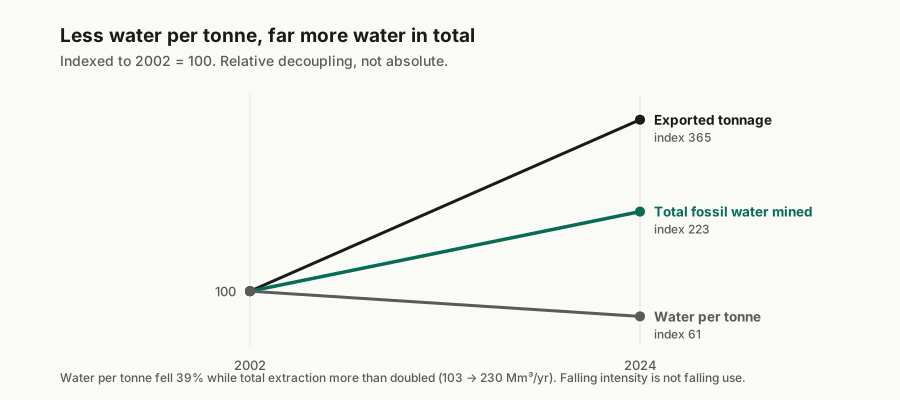
Slope chart indexed to 2002 equals 100. Exported tonnage rises to 365, total fossil water mined rises to 223, and water per tonne falls to 61 by 2024.
Relative decoupling without absolute decoupling: intensity improves while total extraction climbs.

Total extraction more than doubled over the same years, and exported tonnage roughly tripled. Export earnings per unit of mined water barely moved across twenty-two years despite revenue nearly tripling — the growth was underwritten by mining far more fossil water, not by mining it more valuably.

5. Where it becomes legible

A commodity-level depletion measure matters because that is the unit emerging supply-chain regimes work in. The EU Corporate Sustainability Due Diligence Directive obliges large in-scope firms to account for adverse environmental impacts across their chains of activity, and the impacts it names include excessive water consumption and degradation that impairs access to safe drinking water.

Two limits keep that modest. The regime is still being built, so the significance is legibility rather than an imminent deadline. And such obligations attach only to EU importers — about 44% of this trade by value in 2017 — while the single largest destination, Morocco, sits outside the regime entirely. The framework’s value is scientific before it is regulatory.

Limitations

This brief summarises a preprint that has not yet undergone peer review.

The replacement cost is an accounting price for what supplying the water will cost once the stock is gone, anchored to the municipal supply the depletion threatens. It is not a market price or a willingness-to-pay measure for irrigation water, and results are reported across the full $0.24–$1.10 per m³ band rather than at a point.

The study does not attribute the observed aquifer depletion to dates via GRACE, does not compute a formal natural-capital set-aside, and does not observe whether the exporting economy reinvests these rents elsewhere — so it makes no claim of a formal Hartwick failure. Export volumes before 2018 are interpolated between six directly reported years; the result holds on those anchor years alone. Which governorate’s dates reached which country is not recoverable from the data, so no origin-by-destination claims are made.

Sources

This brief is derived from the preprint:

Gasmi, T., Guesmi, R., Abdelbari, S., Boulaares, S., Albarghati, S. (2026). The fossil-water debt of agricultural exports: satellite gravimetry and a climate–yield re-coupling index, demonstrated for Tunisian dates. EarthArXiv. https://doi.org/10.31223/X5KV3F

  • Data and code: github.com/tanitdata/DatePalm (ecological_debt/), archived at 10.5281/zenodo.21251191
  • Companion study, peer-reviewed, which establishes the aquifer decline this brief builds on: Gasmi et al. (2026), Agricultural Water Management — see Southern Tunisia’s date oases
  • Primary sources: ONAGRI (date production by governorate); CRDA Tozeur, Kébili, Gafsa, Gabès (extraction volumes and well records); NASA JPL GRACE/GRACE-FO mascons RL06.3; ERA5-Land (Copernicus); INS DataStore and UN Comtrade (HS 080410) for export volume and value
  • AI-native access to the Tunisian portals: the study read agridata.tn and the INS data portal programmatically through the studio’s agridata MCP and INS MCP servers